Documentation -
Tutorial -
Sample Cuts
FuzzyFilter - Documentation

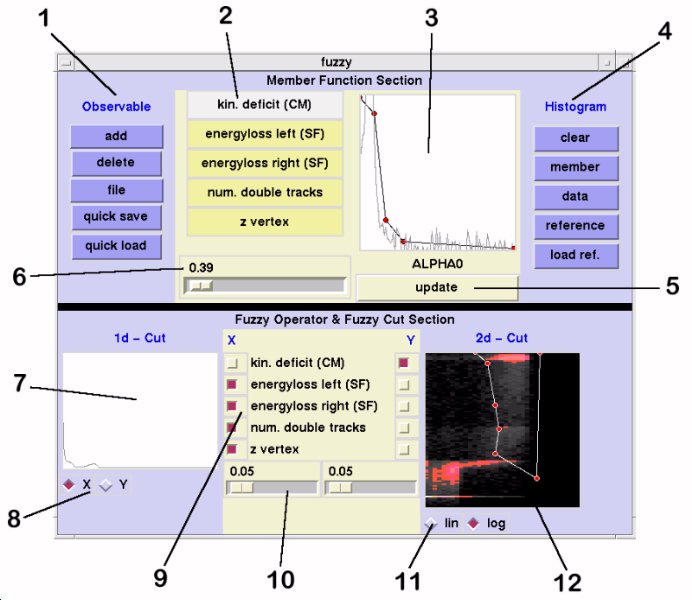
1: Observable Buttons
- ADD:
- add a new subevent to the observable-list (2)
- DELETE:
- delete selected observable from observable-list (2)
- FILE:
- load/save all settings
- QUICK SAVE:
- save all settings to file 'quicksave.ff'
- QUICK LOAD:
- load all settings from file 'quicksave.ff'
2: Observable-List
Shows the observables currently available for the generation of the FuzzyCut.
The actual selected observable is highlighted.
Choose new actual observable by pressing the corresponding observable button.
3: Memberfunction Window
Use the following commands to design the memberfunction for the highlighted observable (2):
- left-click:
- move red circle until button release
- middle-click:
- create new segment at actual mouse
position (Energyrange 'low' must be selected, see (13) )
- right click:
- delete red circle and the corresponding
segment (Energyrange 'low' must be selected, see (13) )
4: Histogram Buttons
Determines what histogram is shown in the memberfunction window (3).
Histograms are updated by pressing the buttons again.
- CLEAR:
- no histogram is shown in the memberfunction window
- MEMBER:
- shows the supposed memberfunction, that is REFERENCE/DATA
- DATA:
- shows the analyzed data
- REFERENCE:
- shows the reference data
- LOAD REF.:
- load new reference histograms
- The MEMBER-histogram is a good guideline for designing memberfunctions.
- REFERENCE-data is underground-free data.
- For analyzing CH2-data use carbon-subtracted data as reference, for analyzing ABT-data use your best cuts to get reference data (ALPHA<6 should be sufficient for all subevents beside ALPHA).
- Modify and use refHistos2d.hoc for the generation of reference histos (but do not change the histogram definitions!!!)
5: Update Button
Any changes to the observable list or the memberfunctions will not be active until the update button is pressed.
The update button is yellow when the actual settings are up to date with YODA, otherwise the button is red.
Do not try to overlay histograms or change FuzzyCut settings (7-12) while the update button is red.
6: Modificator
The memberfunction values are combined in the Fuzzy Operator Section (9) by evaluating the formula
m1^p1 (g) m2^p2 (g) ...
where (g) is the gamma-operator m# are the values of the memberfunctions and p# are the modificators.
7: 1d-Cut Window
One-dimensional plot showing the X or the Y combination of observables, respectively.
Cuts can be defined using the following commands:
- left-click:
- define cut at the actual mouse position (red line occurs, corresponding radiobutton (8) turns red)
- right-click::
- unset cut
All events to the left of the cut will be marked as 'bad events'.
X- and Y- can be defined at the same time (equivalent to a rectangular cut in the 2d-Cut window (12))
8: 1d-Cut Radiobuttons
Choose which combination of observables (X or Y) is shown in the 1d-Cut Window (7). Press button again to update the histogram.
9: Fuzzy Operator Section
Define combinations of the selected observables (2).
X and Y are the new 'observables' used to define cuts.
The 1d-Cut Window (7) shows X or Y respectively, whereas the 2d-Cut Window (12) shows the plot X vs. Y.
Cuts can be defined in both windows.
10: Gamma Slider
The gamma operator is defined as follows:
a (g) b = (a AND b)^g * (a OR b)^(1-g)
where AND and OR are fuzzy operators.
- X and Y can have different values for g.
- The slider has no effect when only one observable is selected.
11: 2d-Cut Buttons
Choose linear or logarithmic (in z) plot of X vs. Y.
Press button again to update plot.
12: 2d-Cut Window
Shows X vs. Y.
Define 2d-Cut by using the following commands:
- left-click:
- move red/white circle until button release
- middle-click:
- add new segment at actual mouse position
(Energyrange 'low' must be selected, see (13) )
- right-click:
- delete red/white circle and the
corresponding segment (Energyrange 'low' must be selected, see (13) )
- New segments are inserted between the nearest knot and the nearest neighbour.
- White circles show that the 2d-Cut polygon has changed and is not up to date with YODA. Press the LIN or LOG radiobutton to transfer the new 2d-cut to YODA (circles turn red).
- Events outside the polygon will be marked as 'bad events'.
Zoom-commands:
- ctrl-left-click:
- actual mouse position is the new left bottom corner
- ctrl-middle-click:
- zoom out (= no zoom)
- ctrl-right-click:
- actual mouse position is the new right top corner
13: Energy Section
Memberfunctions and 2d-FuzzyCuts are functions of beam energy.
This must be taken into account when ramp data is analyzed.
Therefore, you can model the memberfunctions and the
2d-polygon for three energys (low/mid/high). A smooth (linear) variation of all
parameters with energy will then be used for the further analysis.
Press the low/mid/high buttons to select an energy. Notice that the
values for 'low' and 'high' must be set via the broker
variables minRampEnergy and maxRampEnergy. This is also
true for flattop data (i.e. minRampEnergy = maxRampEnergy).
New nodes (member function or 2d-cut polygon) can only be added or
deleted in the energy state 'low'. There is a COPY button that
lets you copy a 2d-cut polygon from one energy state to the other (two)
energy states. The most convenient way to model 2d-cut polygons is to
model the polygon for the 'low' energy state, press the COPY
button and then model the (small) variations for the 'mid' and 'high'
energys.
The 'mid' and 'high' energy states will be ignored when the broker
variables minRampEnergy and maxRampEnergy have the same
value (flattop data).

