 |
First, change to the directory where the file dummy.hoc resides. To run our simple user task, start YODA from the commandline with:
yoda
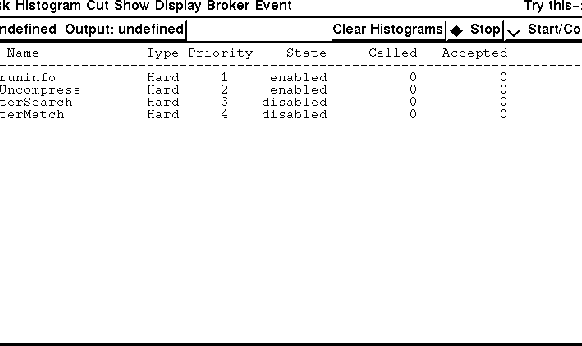
You should see something like the following:
The (xterm) window, where you typed the yoda startup command becomes
the terminal window, providing a commandline-oriented
input/output facility to YODA. You can do all available YODA actions
from here. Alternatively, you can use YODA's main window (see
figure 4.1), which provides a somewhat more comfortable
graphical interface to YODA's functions. It consists of some pull-down menus, some push- or radiobuttons, and a rather large
status window, which is mainly empty at starup. The latter is updated
periodically to provide information on runs, tasks, histograms and
cuts, as requested. You can select the information to be displayed
with the Show pull-down menu.
Now, select the entry Open Inputprocess from the File
pulldown-menu. In the dialog box showing up, you enter the following
input command:
server -D 20
This starts the data-serving program. The options given activate the dummy-data mode, which is made only for testing purposes. YODA then generates all the data itself (just dummy-events containing random values, but with the data description as in this example). The number means the number of events generated per second.
If this screen (or a similar one) doesn't show up, you're in trouble. Check the following:
yoda: command not found,
check your $PATH environment variable. It must contain the path
of the YODA executable.
invalid command name "wm" your DISPLAY environment variable is
not correctly set and YODA is unable to open a window. Ask your local
expert for details.
To run your analysis task, it must first be loaded into YODA. Do
so by choosing the entry Load... from the Task pulldown
menu. A fileselectbox opens and offers you the files in the current
directory to choose. Click on dummy.hoc, and click OK.
YODA now reads the file dummy.hoc, checks it for syntax and --
if successful - adds the task to its list of active tasks.
If you see error messages in the terminal window (most likely typing mistakes or missing semicolons), the task will not be loaded. Fix the errors (unfortunately, the error description is not very verbose. Usually, at least the line number should be helpful), and try again.
Eventually, the task should appear in YODA's status subwindow with its name and with the indication ''active''.
Now, click on the Start/Continue radiobutton located at the right of
YODA's main window. You should see the task being called (watch the
called column in the status display, and the accepted
field increasing as well. This means that events are being dispatched
to your analysis task.
Since you put the printf(...) into the procedure
analyze(), you should also see the desired output in the
terminal window. Don't worry about obviously random values appearing,
since the input (DUMMY) data is in fact generated randomly.
Now you can play around with the various YODA functions. Try to en- or
disable the task, try to reload it a second time, choose different
information to be shown in the status window (use the Show
pulldown menu), and try to stop the data processing by clicking on the
Stop radiobutton. You can resume the analysis by
clicking Start/Continue again. If you have enough, you can
leave YODA by choosing Quit from the Task pulldown
menu.
Now you're ready to produce some histograms.